The 1938 and 1999 aerophotosurveys


The new map of fallen tree directions.

In the last 40 years, the map of fallen tree azimuths used for comparison with theoretical models was the one constructed on the basis of of azimuth data measured in 1958-1961 (See image). The new map of fallen tree directions has been obtained from: 1) revised Fast data, 2) data from the 1938 and 1999 aerophotosurveys and 3) Anfinogenov 1967 data. A reliability degree for each trial area averaged azimuth has been introduced. In the figure, the yellow, sepia and black areas correspond to a high, medium and low reliability, respectively. The external frame represents Fast "kilometer" coordinates, while the inner - the geographical ones.
On the basis of the tree fall data and earlier eyewitness testimonies we consider that the Tunguska Cosmic Body was a multiple bolide formed by at least two bodies of similar mass (see papers pdf, 211 kb, pdf, 18.9 Mb). They likely entered the atmosphere very close to each other following parallel trajectories with azimuths ~135° and an inclination of the total combined shock wave axis between 30° and 50°. The first body, with a greater mass, emitted the maximal energy at a height of about 6-8 km. The second, of minor mass, flew a little higher, on the right side and behind the first body, following the azimuth ~135° in the direction of the lake Cheko.

To download a higher resolution image click here: 267 kb or here 229 kb.
This image can be copied and published only with a full reference to:

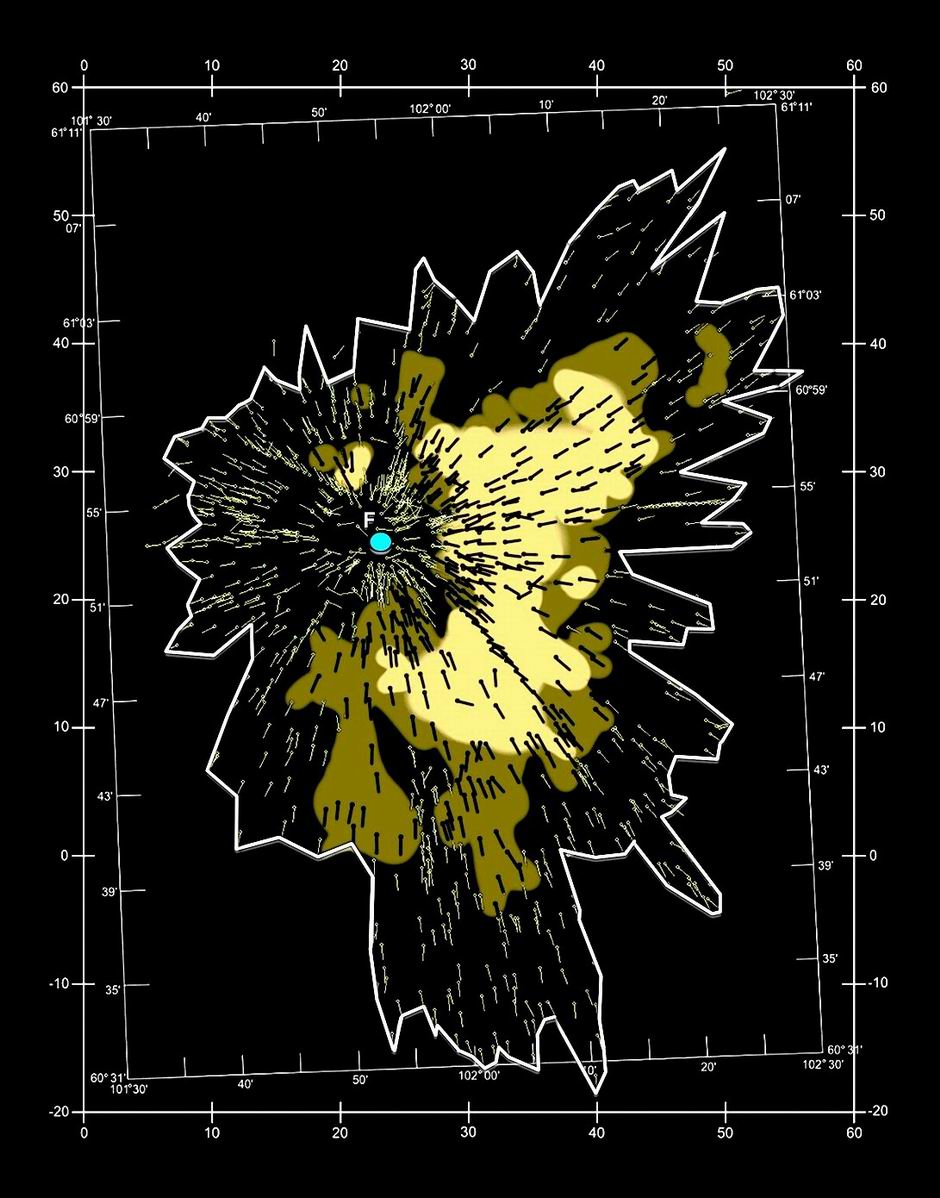
Longo G., Di Martino M., Andreev G., Anfinogenov J., Budaeva L., Kovrigin E.: "A new unified catalogue and a new map of the 1908 tree fall in the site of the Tunguska Cosmic Body explosion." In: Asteroid-comet Hazard-2005, pp. 222-225, Institute of Applied Astronomy of the Russian Academy of Sciences, St. Petersburg, Russia, 2005. (pdf, 211 kb)


Back to the TUNGUSKA99 Photos

Back to the Aerophotosurveys

Back to the Photo Gallery

Back to the Tunguska Home Page